
- Developer
- shuttletechnologies
- Installs
- 5K+
- Downloads
- 0
- Views
- 1
- Updated
- Oct 26, 2026
Screenshots
About Stock Profit & Avg. Calculator
Looking to calculate your stock profit, average price per share, or plan your next trade? Stock Profit & Avg. Calculator is your complete financial calculation toolkit designed for investors and traders to make disciplined, mathematically sound decisions.
Whether calculating real-time profit and loss (P&L), averaging down on stock holdings, or planning the exact target price per share, this app delivers instant, accurate calculations with zero guesswork.
━━━━━━━━━━━━━━━━━━━━━━━━━━
🔹 CORE FEATURES
━━━━━━━━━━━━━━━━━━━━━━━━━━
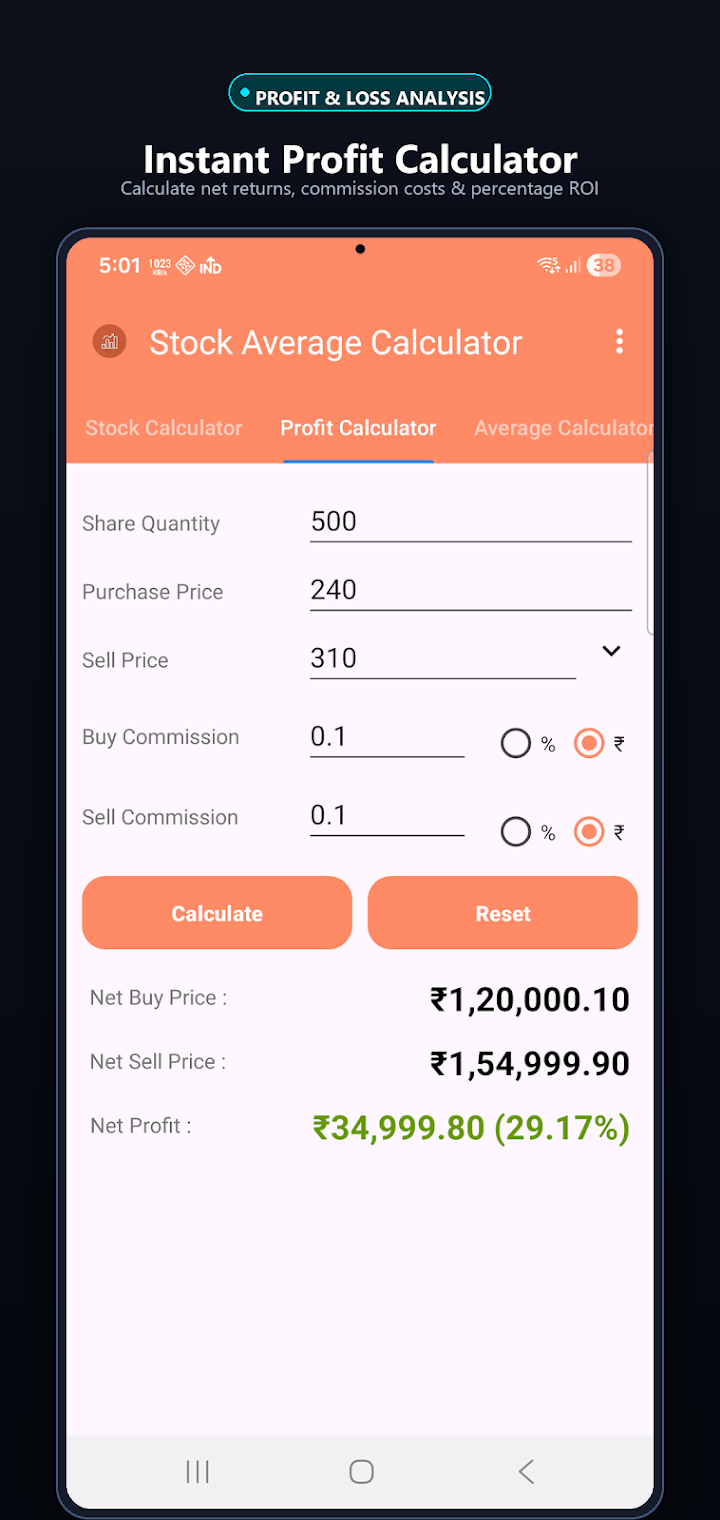
📈 1. Target Profit & Loss (P&L) Calculator
- Calculate total profit, net returns, return on investment (ROI %), and net proceeds.
- Configurable brokerage and transaction charges (percentage or fixed price).
- Dual Long & Short trade mode support for equity delivery and intraday trading.
📊 2. Stock Average Calculator (Average Price Per Share)
- Calculate the weighted average price per share across multiple stock purchases.
- Example: Buy 100 shares at $250 and 100 shares at $150. Instantly see your updated average price: $200 per share (Total: 200 shares, $40,000).
- Supports fractional shares and high-precision decimal calculations.
🎯 3. Target Average Price Calculator (Reverse Averaging)
- Determine the exact new shares required to bring your average down to a desired target price.
- Example: Hold 100 shares at $250. Market drops to $150. Calculate how many shares to buy at $150 to reach a target average of $200.
- Plan your capital allocation with precision before placing orders.
⚡ 4. Smart Stock Averaging (3 Flexible Modes)
- Quantity Mode: Calculate average based on number of shares.
- Amount Mode: Calculate average and shares based on a fixed capital budget.
- Target Mode: Solve for target average, required shares, and outlay in one tap.
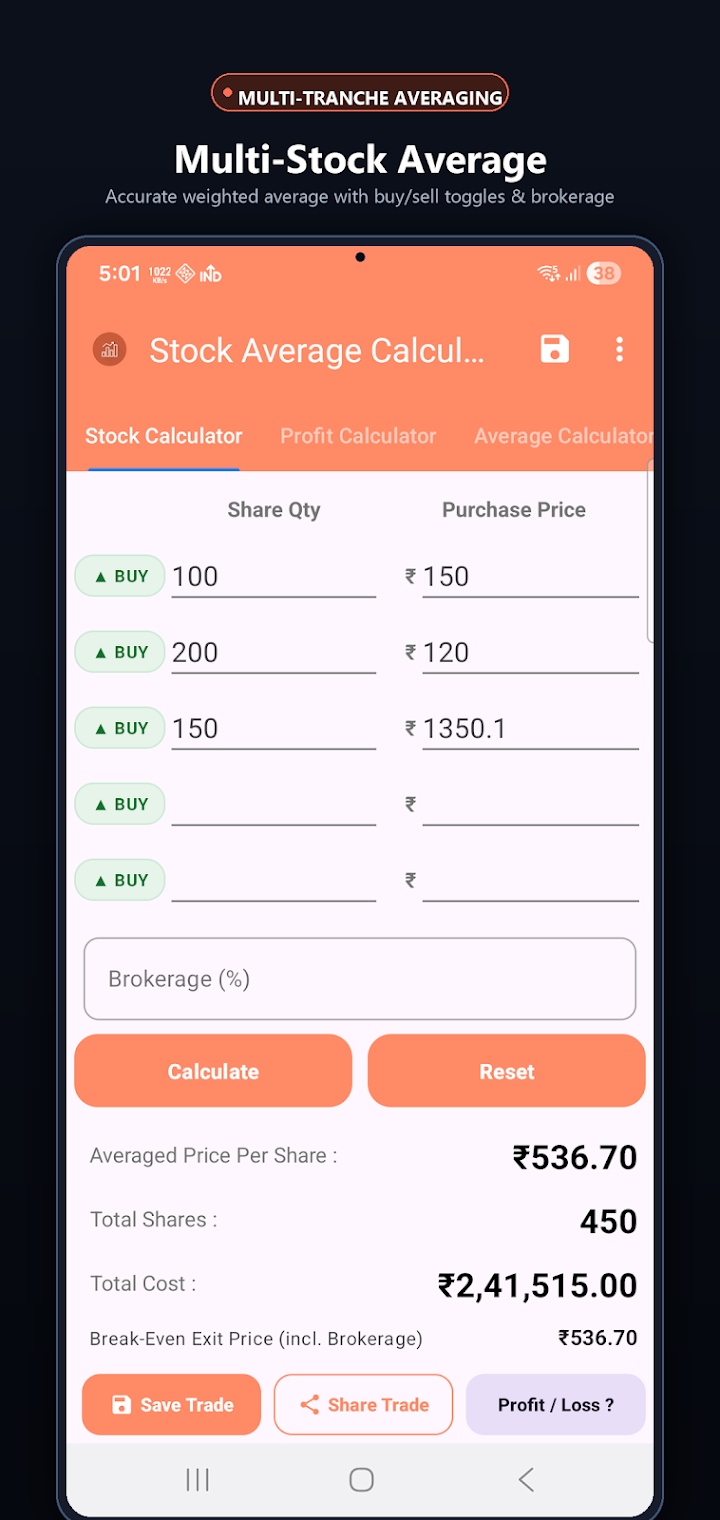
🧮 5. Multi-Stock Portfolio Averaging
- Average up to 10 purchases or trade legs simultaneously in a single clean overview.
- Add, edit, or delete purchase lines with portfolio summaries.
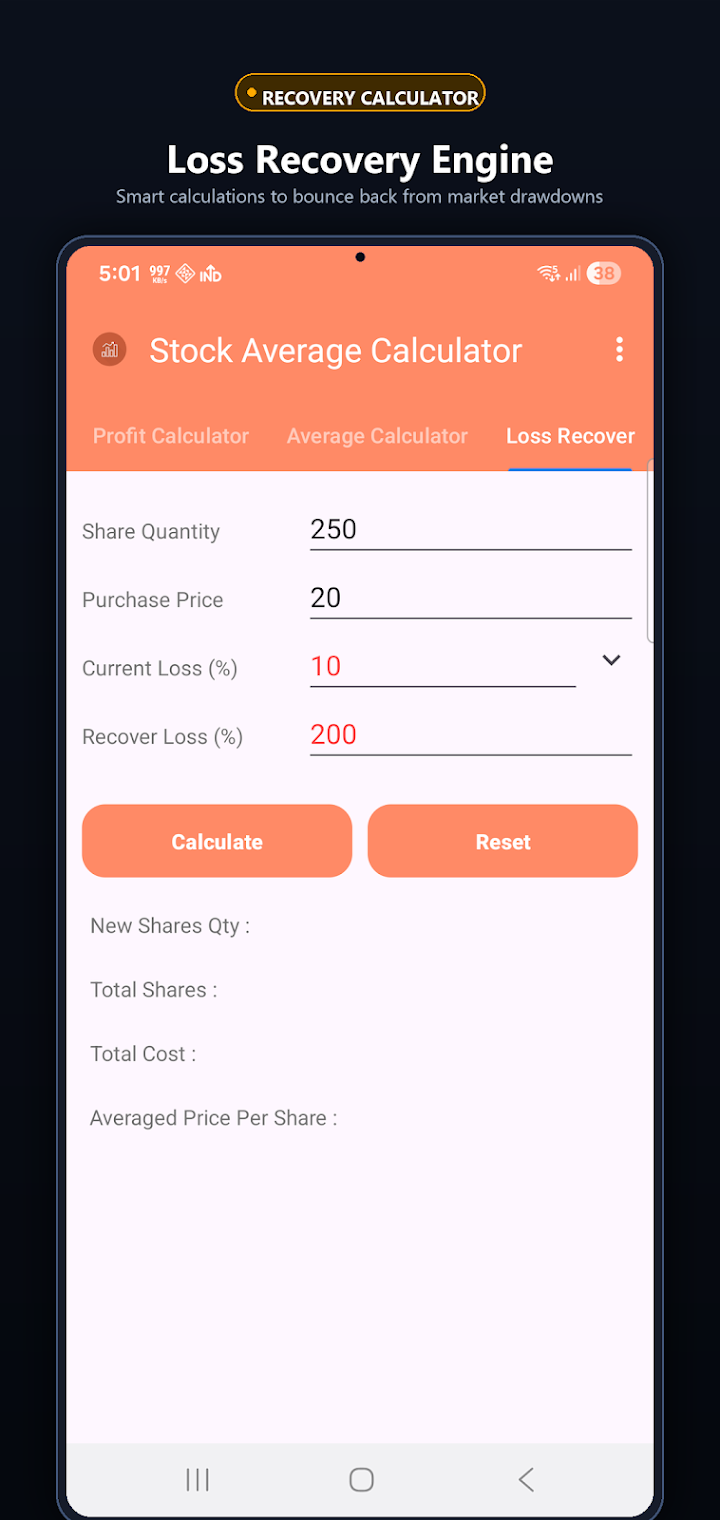
📉 6. Loss Recovery Calculator
- Plan strategic recovery purchases when a stock price declines.
- Calculate additional shares needed to recover a target percentage of loss and lower your break-even exit point.
⚖️ 7. Risk–Reward & Position Size Calculator
- Plan disciplined trade setups before entering the market.
- Enter Entry Price, Stop-Loss, and Target Price to calculate:
- Capital at risk per share & total outlay
- Potential reward per share & target profit
- Risk-to-Reward Ratio (e.g., 1:2, 1:3, 1:4)
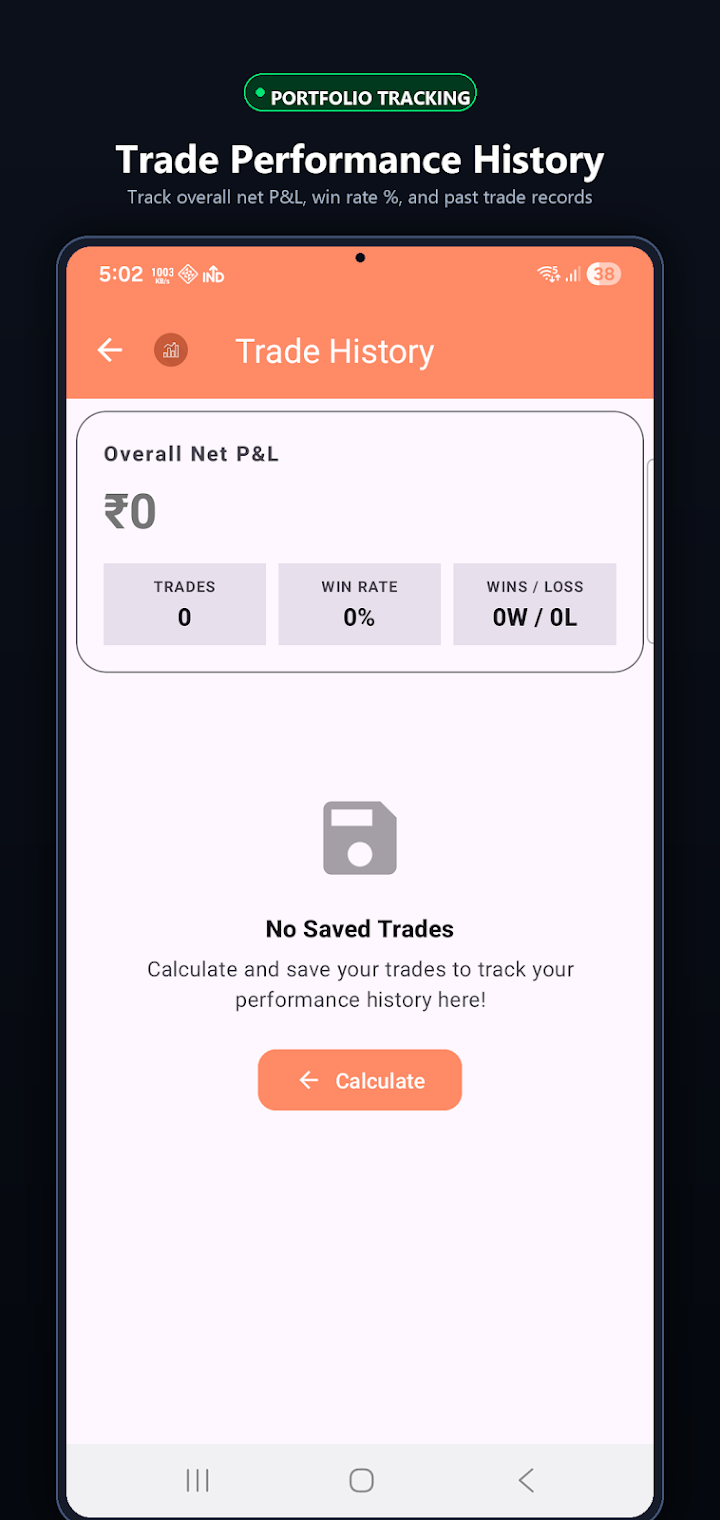
📓 8. Trade History & Performance Journal
- Save calculations directly to your local on-device trade journal.
- Track overall Net P&L, Win Rate %, Total Trades, and Win/Loss distribution.
- Filter by All Trades, Profits, or Losses with export/backup support.
🌍 9. Global Stock Market Timings
- Live status (OPEN / CLOSED) for major exchanges: NYSE, NASDAQ, LSE, Euronext, Tokyo, Hong Kong, Sydney, and 24H markets.
- Automatically converted to your local device timezone.
━━━━━━━━━━━━━━━━━━━━━━━━━━
🔹 KEY ADVANTAGES
━━━━━━━━━━━━━━━━━━━━━━━━━━
- Fast & Lightweight: Instant calculations with smooth, responsive performance.
- Private & Secure: All calculations and trade records remain stored locally on your device. No registration or account required.
- Global Currency Support: Compatible with $, €, £, ₹, ¥, and 160+ world currencies.
- Decimal Precision: Configure precision from 2 to 10 decimal places.
- 16+ Curated Themes: Dark Studio, Pitch Black AMOLED, and Minimalist Light themes.
📌 Disclaimer:
This application is strictly for mathematical calculation, planning, and educational purposes. It does not provide financial advice, stock recommendations, or broker connectivity. Always make investment decisions independently or consult a qualified financial professional.